[Source: PBS/SoCal News] On Jan. 22, 2018, the Trump administration announced plans to impose punitive duties on solar panels imported from abroad. This decision came in response to a complaint filed by two solar companies, but much of the industry opposes the action, which trade groups say will increase the cost of solar projects and depress demand. To illustrate what’s at stake, energy scholar Joshua Rhodes provides some context on the U.S. solar industry and its opportunities and challenges.
How big is the U.S. solar industry, and what is its growth trajectory?
The U.S. solar industry generated US$154 billion in economic activity in 2016, including direct sales, wages, salaries, benefits, taxes and fees. Its revenues have grown from $42 million in 2007 to $210 million in 2017.
About 25 percent of total new power plant capacity installed in 2017 came from solar. Total installed U.S. solar capacity is over 50 gigawatts – the equivalent generating capacity of 50 commercial nuclear reactors.
 Nearly half of utility-scale capacity installed in 2017 came from renewables, and about half of that was solar. Graphic via The Conversation
Solar is projected to continue to grow for the foreseeable future. However, recent events such as the solar trade tariff and tax code changes could dampen that trend. According to one estimate, the tariff alone will reduce solar installations by 11 percent from 2018 through 2022.
The industry directly or indirectly employs about 370,000 people in the United States, of which 260,000 are full- or part-time. Solar photovoltaic installers make up about half of this workforce. In fact, solar PV installer is currently the fastest-growing job in the nation, with a median annual salary of nearly $40,000.
For comparison, the coal industry only supports about 160,000 jobs. Electric power generation from solar and wind energy combined contributes about three times as many jobs as electricity production from fossil fuels.
 Graphic via The Conversation/DOE.
Why are most of the solar panels that are installed in the United States manufactured overseas? Is this pattern likely to change?
About 80 percent of solar panels installed in the United States last year were built overseas. While the industry was invented here, China has poured up to $47 billion into tax breaks and incentives in order to develop what it views as a strategic capability. Along with an abundant supply of cheap skilled labor, these investments reduced the price of solar panels by 80 percent between 2008 and 2013.
Some foreign solar panel manufacturers are negotiating to open factories in the United States, much as foreign car manufacturers did during the Reagan administration. However, any new manufacturing is likely to be highly automated, so it might not generate major numbers of new jobs.
Which sectors and states produce the most solar power today?
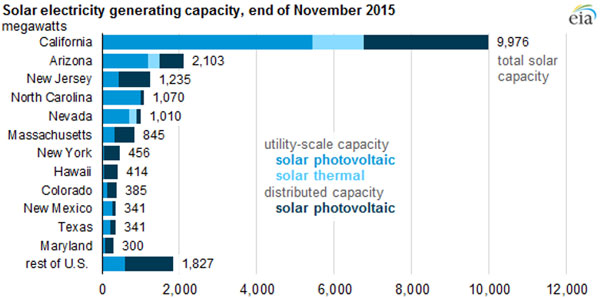
About 60 percent of total U.S. solar generating capacity is in a relatively small number of very big projects owned by power companies. The rest is what’s known as distributed capacity, meaning small-scale projects that generate energy at many sites. It includes rooftop solar power on homes, community solar projects and commercial installations, such as solar panels on the roofs of big-box stores like Walmart.
California has nearly half of all U.S. solar electricity generating capacity, followed by Arizona, New Jersey and North Carolina. Alaska, North Dakota and South Dakota are the only states with less than one megawatt of small-scale solar photovoltaic capacity.
 Graphic via The Conversation
How affordable is solar power for customers who aren’t affluent?
Affordability can be a barrier to going solar, but there are ways to reduce it. For example, some utility customers can subscribe to community solar programs – projects that serve multiple customers in a single area – and even reduce their rates by doing so. Community solar projects do not usually require customers to own their homes, so renters can take part.
Source: PBS/SoCal News
January 27, 2018


